Dashboard Design Principles: The Definitive Guide (2026)
As UX designers, we need to create dashboards that are clear, purposeful, and user-centric. “Effective dashboards should not only present data but also convey the story behind it, guiding users toward making informed decisions without overwhelming them with details,” as UX Design World emphasizes. This statement underscores the essence of great dashboard design: presenting information in a way that is not only accessible but also actionable.
Creating data-driven applications with interactive dashboards can be complex and time-consuming, requiring seamless collaboration between designers, developers, and product teams. That’s where UXPin Merge comes in—a tool that bridges the gap between design and development, allowing teams to build highly interactive, production-ready dashboards using real components.
With UXPin Merge, design teams can import live components from a Git repository or Storybook and use them to create interactive UI designs that reflect the exact behavior of the final product. Request access to UXPin Merge.
What is a Dashboard?
A dashboard is a visual display of essential information needed to achieve specific business objectives. It consolidates data from various sources into a single interface, using visualizations such as charts, graphs, and tables to present insights clearly and concisely. Dashboards are primarily used for tracking and analyzing KPIs, identifying trends, and making informed decisions based on real-time data.
Types of Dashboards
By understanding the unique purposes and use cases of these dashboard types, designers can create more targeted and effective dashboards that cater to specific user needs.
Analytical Dashboards
Analytical dashboards are used to identify trends, patterns, and insights over time. They support strategic decision-making by presenting complex datasets through detailed visualizations like line graphs, scatter plots, and histograms. Typically used by data analysts or business intelligence teams, these dashboards help answer questions like, “What are the factors driving sales trends over the last quarter?”
Example: A sales performance dashboard that analyzes historical sales data, identifies top-performing products, and reveals seasonal trends. This dashboard could include charts that compare monthly sales figures year-over-year, helping stakeholders make strategic decisions about future campaigns.
Operational Dashboards
Operational dashboards are designed for real-time monitoring and quick decision-making. They display data that is frequently updated, such as daily sales figures, website traffic, or production outputs. These dashboards are ideal for managers who need to track day-to-day operations and respond promptly to emerging issues.
Example: A customer support dashboard that monitors the number of open tickets, average response time, and agent availability in real time. This type of dashboard allows managers to allocate resources efficiently and maintain service quality.
Strategic Dashboards
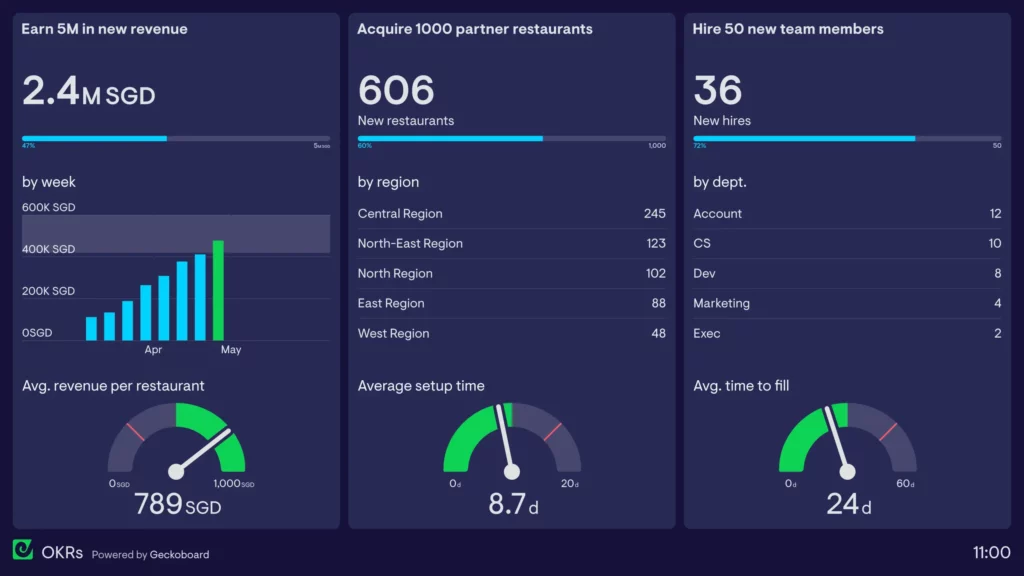
Strategic dashboards offer a high-level overview of the organization’s performance, focusing on long-term goals and outcomes. They are used by executives to monitor key performance indicators (KPIs) like revenue growth, market share, or customer satisfaction over an extended period. Strategic dashboards prioritize simplicity and clarity, presenting only the most critical data needed for executive decision-making.
Example: An executive KPI dashboard that tracks overall company performance metrics such as quarterly revenue, year-to-date profit margins, and employee engagement scores. This dashboard allows executives to assess whether the company is on track to meet its strategic objectives.
Tactical Dashboards
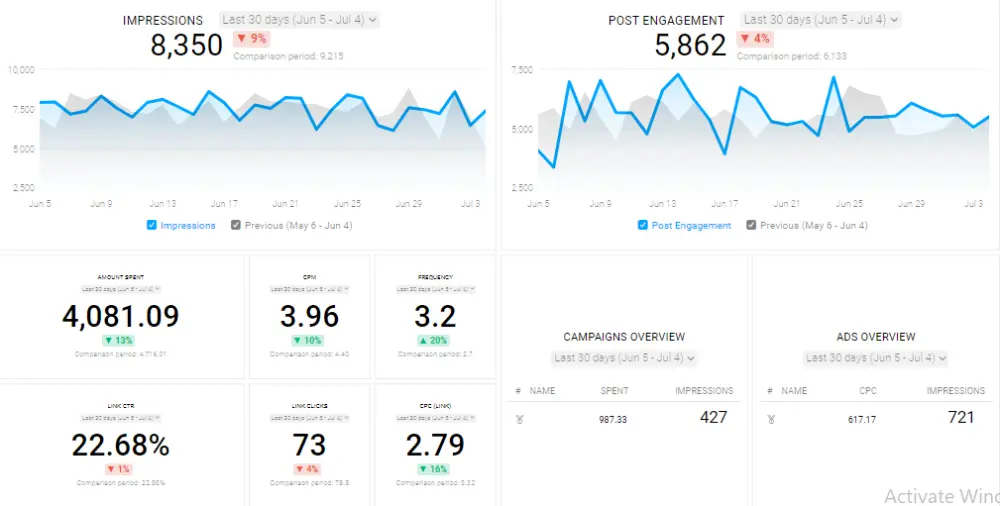
Tactical dashboards bridge the gap between operational and strategic dashboards. They focus on short-term goals and provide insights into specific areas of the business, such as project management or marketing campaign performance. Tactical dashboards are used by mid-level managers to implement strategies based on analytical data and operational updates.
Example: A marketing campaign dashboard that tracks campaign performance, including ad spend, conversion rates, and customer acquisition cost. This type of dashboard helps marketers adjust their tactics in response to real-time performance data.
Why Dashboard Design Matters
Dashboards have become a crucial tool in modern business environments, serving as a central hub for data-driven decision-making. In the realm of App design, a well-designed dashboard is more than just a data visualization tool; it provides a structured and intuitive way to track KPIs (Key Performance Indicators), monitor business processes, and gain actionable insights at a glance. This includes website dashboards, which help teams track user behavior
The role of dashboards in decision-making extends beyond data presentation. They act as decision-support systems, helping stakeholders identify opportunities, pinpoint issues, and respond quickly to changes.
For example, a sales dashboard might track sales revenue, pipeline metrics, and individual performance to give managers a clear view of team performance and areas for improvement. By presenting this data visually, dashboards enable faster comprehension and a deeper understanding of complex information, facilitating data-driven decisions.
The Impact of Well-Designed Dashboards
When designed effectively, dashboards can significantly enhance business intelligence (BI) by transforming raw data into meaningful insights. Here’s how:
- Improved Data Accessibility and Usability: Well-designed dashboards simplify complex data, making it accessible to non-technical stakeholders. With a focus on usability and intuitive layout, they reduce the cognitive load and help users find the information they need quickly.
- Enhanced Decision-Making: By providing real-time data and key metrics, dashboards empower stakeholders to make timely decisions. This immediacy is crucial in fast-paced business environments where quick reactions to changes in performance can give companies a competitive edge.
- Performance Tracking and Goal Setting: Dashboards allow businesses to monitor performance against set targets and KPIs. For instance, a marketing dashboard might show campaign performance in terms of reach, engagement, and conversion rates, helping teams align their efforts with strategic goals.
Research shows that organizations leveraging dashboards for BI see a higher return on data analytics investments, as they can turn insights into action more efficiently. For instance, a study by Dresner Advisory Services revealed that organizations with effective BI tools, such as dashboards, were twice as likely to experience improved decision-making capabilities and a 24% increase in revenue growth.
Common Issues with Poorly Designed Dashboards
Despite their potential, many dashboards fall short due to poor design practices, leading to low usability and ineffective decision-making. Common issues include:
Clutter and Overwhelming Layouts
Many dashboards suffer from information overload. When too many metrics and visualizations are crammed into one screen, users struggle to identify what’s most important. This cluttered layout can lead to confusion, making it harder to extract valuable insights.
Lack of Hierarchical Structure
Without a clear visual hierarchy, dashboards can fail to communicate the relative importance of information. Users might overlook critical data or spend too much time searching for relevant insights.
Inconsistent Design and Misleading Visuals
Inconsistent use of colors, fonts, or chart types can cause misinterpretation of data. For example, using the same color for positive and negative metrics can lead to incorrect conclusions. Read about design consistency and how to achieve it.
Neglecting User Context and Needs
A one-size-fits-all dashboard rarely works. Effective dashboards should be tailored to the specific needs and context of the user, whether they are a sales manager looking for revenue trends or a product manager tracking feature usage.
Key Characteristics of Successful Dashboards
Regardless of the type, successful dashboards share certain characteristics that make them effective tools for data visualization and decision-making. These characteristics ensure that dashboards are not only visually appealing but also functionally robust and user-centric.
Clarity: Ensuring Users Can Interpret Data Quickly
Clarity is paramount when it comes to dashboard design. A cluttered or confusing layout can obscure the most critical information and hinder decision-making. To ensure clarity:
- Use a clear visual hierarchy to prioritize information.
- Choose appropriate visualizations, such as bar charts for comparisons and line charts for trends, to present data effectively.
- Limit the number of visual elements to avoid overwhelming users with too much information at once.
Flexibility: Allowing Customization and Interactivity
Dashboards should cater to diverse user needs by offering flexibility in how data is displayed and interacted with. Features like filters, drill-down capabilities, and custom views allow users to explore the data at their own pace and adjust the dashboard to suit their specific needs. Incorporating interactive elements can transform a static dashboard into a dynamic tool that provides deeper insights.
Tip for Designers: Use UXPin’s interactive components to prototype dashboards that include these features, enabling users to see how different configurations and interactions will work in the final product.
Responsiveness: Adapting to Different Devices and Screen Sizes
With the increasing use of mobile devices and varying screen sizes, responsiveness is a critical characteristic of any dashboard. A responsive dashboard adjusts its layout and visualizations based on the device, ensuring that users have a consistent experience whether they’re on a desktop, tablet, or smartphone. Key elements like font size, spacing, and the arrangement of visualizations should be fluid and adaptable.
Tip for Designers: Create responsive prototypes in UXPin to test how your dashboard design behaves across different devices. Use breakpoints and scalable design techniques to optimize the layout for various screen sizes.
Essential Dashboard Design Principles
Designing effective dashboards requires a deep understanding of visual hierarchy, consistency, cognitive psychology, and accessibility. A well-structured dashboard not only presents data but also guides users in interpreting it, making complex information more approachable and actionable. This section outlines the key design principles to consider when creating dashboards that prioritize usability, functionality, and inclusivity.
1. Establish a Clear Visual Hierarchy
In dashboard design, visual hierarchy is crucial for guiding users’ attention to the most critical information first. By using layout, color, and typography strategically, you can emphasize high-priority data and minimize distractions.
- Layout: Organize information logically by placing the most critical data at the top or left-hand side of the dashboard, as these areas are naturally where users look first. Group related data points together and use white space to separate sections, making it easier for users to scan and locate key insights.
- Color: Use color to differentiate categories and indicate relationships between data points. For example, use contrasting colors for KPIs that represent positive vs. negative trends or different departments. Reserve bright colors for highlighting anomalies or urgent information that requires immediate attention.
- Typography: Utilize font size and weight to establish hierarchy. Larger, bolder fonts can be used for titles and main metrics, while smaller fonts work well for labels or less critical information. Keep font styles consistent across the dashboard to maintain a cohesive look and feel.
Tip for Designers: Use UXPin’s typography and color styling options to set up a style guide that ensures visual consistency across different dashboards and components.
2. Maintain Consistency
Consistency is a cornerstone of good design. When dashboards lack consistency, users can become confused and overwhelmed, reducing the dashboard’s effectiveness. Establishing consistent patterns for navigation, data labels, and interaction states creates a more intuitive user experience and improves the dashboard’s usability.
- Consistent Visual Elements: Use the same color scheme, font styles, and chart types across different dashboards within a product. This practice helps users build a mental model of your dashboards and reduces the learning curve.
- Uniform Interaction Patterns: Whether users are filtering data, drilling down into specific information, or switching between different views, ensure that these interactions behave consistently throughout the dashboard. This reduces confusion and builds user confidence when navigating complex dashboards.
Tip for Designers: Utilize UXPin’s design systems capabilities to create reusable components, such as buttons, menus, and charts, that ensure visual and functional consistency across multiple dashboards.
3. Minimize Cognitive Load
Dashboards are often used to display large amounts of data, making it essential to minimize cognitive load by simplifying the design and focusing on the essentials. Avoid unnecessary details and distractions that can overwhelm users.
- Remove Non-Essential Elements: Reduce the number of visual elements on the screen by eliminating duplicate or redundant information. Use whitespace effectively to separate different sections and prevent overcrowding.
- Focus on Actionable Insights: Highlight the most important insights and KPIs, and use interactive elements like tooltips or drill-downs to provide additional information on demand, rather than displaying everything upfront.
- Simplify Navigation: Keep navigation straightforward, allowing users to quickly switch between different views or apply filters without getting lost.
Tip for Designers: Use UXPin’s conditional interactions and states to hide or reveal information based on user actions, ensuring a clutter-free interface that only displays data when relevant.
4. Make Data Accessible and Usable
The primary goal of dashboards is to make data accessible and easy to understand. This involves choosing the right visualizations and ensuring that all design elements support readability and clarity.
- Use Appropriate Data Visualizations: Select chart types that align with the data you’re presenting. For instance, use bar charts for comparisons, line charts for trends, and pie charts for proportions. Avoid complex visualizations like 3D graphs that can distort data interpretation.
- Contrast and Readability: Ensure adequate contrast between text and background colors. Dark text on a light background or light text on a dark background works best. Avoid using overly saturated colors or color combinations that can strain the eyes.
Tip for Designers: UXPin allows you to create prototypes with different data visualization options. Test your designs with users to identify which visualizations are most effective for your audience.
5. Incorporate Accessibility Standards
Accessible design is not just a nice-to-have but a necessity for inclusive dashboards. Designing for accessibility means ensuring that all users, including those with disabilities, can interact with and understand your dashboards effectively.
- Color Blindness Considerations: Avoid using color alone to convey information. Use patterns, labels, or icons in conjunction with color to differentiate data points. Utilize tools like color blindness simulators to check your design’s accessibility.
- Screen Reader Compatibility: Design your dashboard so that screen readers can easily navigate and interpret it. Use ARIA (Accessible Rich Internet Applications) labels and ensure that all interactive elements have appropriate descriptors.
- Keyboard Navigation: Ensure that all interactive elements are accessible via keyboard navigation. This is particularly important for users who rely on keyboards or other assistive technologies.
Tip for Designers: Use UXPin’s accessibility features, such as ARIA attributes and interactive states, to create dashboards that are compatible with screen readers and other assistive devices.
Best Practices for Creating Dashboards
Designing an effective dashboard involves more than just presenting data visually—it requires a strategic approach that aligns with the needs of its users and the goals of the organization. By following best practices, designers can create dashboards that not only look good but also facilitate data-driven decisions. Here are some essential best practices for creating dashboards:
1. Define the Purpose and User Needs
Every successful dashboard starts with a clear understanding of its purpose and the needs of its users. The design process should begin by identifying what the dashboard aims to achieve and who will be using it. This foundational step ensures that the dashboard presents relevant data in a way that resonates with its target audience.
- Conduct Stakeholder Interviews: Start by interviewing stakeholders, such as managers, analysts, and end-users, to understand their expectations and requirements. Ask questions like: “What key decisions will this dashboard inform?” or “What specific metrics are important to track?” Gathering this information helps define the core purpose of the dashboard and aligns it with organizational goals.
- Identify Key Metrics and KPIs: Based on these discussions, outline the key performance indicators (KPIs) that the dashboard should monitor. Prioritize metrics that provide actionable insights and drive decision-making. For example, a sales dashboard might focus on metrics like revenue growth, conversion rates, and customer acquisition costs.
- Create User Personas: Define user personas that represent different types of dashboard users. Consider their technical proficiency, data needs, and how they will interact with the dashboard. This helps in tailoring the design and functionality to suit diverse user groups, from C-suite executives to department managers.
Tip for Designers: Use UXPin’s collaboration tools to share early wireframes and prototypes with stakeholders, ensuring alignment on the dashboard’s purpose and key metrics before moving into high-fidelity design.
2. Organize Data for Clarity
The way you structure and present data on a dashboard significantly impacts its usability and effectiveness. A clear, logical flow of information helps users find what they need quickly and reduces cognitive load.
- Logical Grouping: Group related data points together to create a coherent narrative. For example, in a marketing dashboard, metrics like campaign performance, budget allocation, and ROI can be grouped under a “Campaign Performance” section. Use visual elements like borders, spacing, and background colors to separate these groups and create distinct sections.
- Progressive Disclosure: Use techniques like progressive disclosure to show information gradually, allowing users to access more details as needed without cluttering the interface. For example, start with high-level summaries and provide options to view detailed data through drill-downs or interactive filters.
- Use Hierarchical Design: Place the most critical data points, such as KPIs or summary statistics, at the top of the dashboard. Secondary metrics and supporting information should be positioned below or within interactive panels that users can expand as needed.
Tip for Designers: Leverage UXPin’s data binding feature to connect your prototypes to real or sample data, ensuring that the layout and flow work effectively with actual content.
3. Use Drill-Downs and Filters
To avoid overwhelming users with too much information on a single screen, incorporate drill-downs and filters. These advanced techniques allow users to explore data at their own pace, accessing more granular information only when necessary.
- Drill-Down Capabilities: Use drill-down features to let users click on high-level metrics and access more detailed views or historical data. For example, clicking on a sales revenue chart could reveal a breakdown by product category or sales region.
- Interactive Filters: Include filters that allow users to refine data by date range, category, or other relevant parameters. This helps users focus on specific subsets of data without cluttering the dashboard with multiple static charts.
- Responsive Visualizations: Make sure that the visualizations respond to user interactions. When users apply filters or drill down into data, ensure that charts update dynamically to reflect these changes, maintaining a seamless experience.
Tip for Designers: Use UXPin’s interactive states and variables to create prototypes with working filters and drill-downs, making it easy to test and demonstrate these features to stakeholders.
4. Highlight Key Metrics
Effective dashboards should emphasize the most critical data points, making it easy for users to grasp essential insights at a glance. This involves carefully selecting which metrics to highlight and using visual cues to draw attention to them.
- Select High-Impact KPIs: Choose KPIs that reflect the organization’s goals and provide actionable insights. Avoid overwhelming users with too many metrics—stick to the most meaningful ones that inform decision-making.
- Use Visual Emphasis: Employ visual elements like size, color, and position to highlight key metrics. For example, use larger fonts and bolder colors for primary KPIs, while using lighter shades or smaller text for supporting metrics.
- Contextualize Data: Provide context by showing trends, benchmarks, or targets alongside the data. For example, display a target line on a bar chart to indicate whether a particular KPI is on track.
Tip for Designers: Use color psychology and contrast effectively in your designs. UXPin’s color palettes and text styling options can help you experiment with different visual treatments to find the best way to emphasize key metrics.
5. Iterate and Refine
Creating an effective dashboard is an iterative process that involves continuous refinement based on user feedback and evolving requirements. Regular testing and iteration ensure that your dashboard remains relevant and usable over time.
- Conduct User Testing: Share your dashboard prototypes with a sample of actual users. Observe how they interact with the interface and gather feedback on usability, navigation, and content relevance. Identify any points of confusion or frustration.
- Incorporate Feedback: Use insights from user testing to refine the dashboard’s layout, interactions, and visual design. Make adjustments to improve clarity, usability, and user satisfaction.
- Continuous Improvement: Dashboards are not static—data needs and user preferences change over time. Regularly review the dashboard’s performance and effectiveness, and be open to making updates or redesigns as necessary.
Tip for Designers: Use UXPin’s collaborative feedback features to collect comments and suggestions directly on the prototype. This streamlines the feedback process and ensures all stakeholders have visibility into the changes being made.
Common Mistakes in Dashboard Design
Even the most visually appealing dashboards can fail if they don’t support effective decision-making or overwhelm users with irrelevant data. Avoiding common design pitfalls is crucial to creating dashboards that are not only visually compelling but also provide real value to users. Here’s a look at some of the most common mistakes in dashboard design and strategies for avoiding them.
1. Overloading Users with Information
The Mistake:
One of the most common mistakes in dashboard design is overwhelming users with too much information. When every piece of data seems equally important, the dashboard becomes cluttered, making it difficult for users to find and interpret key insights. This often happens when designers try to fit too many metrics, charts, or filters onto a single dashboard screen, resulting in visual and cognitive overload.
How to Avoid It:
- Prioritize Key Metrics: Focus on the most critical metrics that align with the dashboard’s goals. Remove any data that doesn’t directly support decision-making or provide additional context. Start with high-level summaries and allow users to access more detailed information through drill-downs or secondary screens.
- Use Visual Hierarchy: Establish a visual hierarchy by organizing data logically and using visual cues such as font size, color, and spacing to differentiate between primary and secondary information. For example, place the most critical metrics in prominent areas like the top-left corner of the dashboard, where users’ eyes are naturally drawn.
- Implement Progressive Disclosure: Use techniques like progressive disclosure, which involves revealing information gradually, so users see only the most relevant details first. This helps prevent information overload while allowing users to dig deeper when necessary.
Example Strategy: Use a simplified dashboard that shows only a few core KPIs at first glance. Include interactive elements like dropdown menus or hover actions to reveal more detailed information without cluttering the main view.
2. Using Inappropriate Visuals
The Mistake:
Choosing the wrong type of visualization is a frequent mistake that can lead to misinterpretation of data. For example, using pie charts to represent changes over time or displaying too much data in a single line chart can make it difficult for users to derive meaningful insights. The misuse of 3D charts or overly complex graphics can also distort information and confuse users.
How to Avoid It:
- Match Visuals to Data Types: Select chart types based on the nature of the data and the insights you want to communicate. For instance, use line charts to show trends over time, bar charts for comparisons, and scatter plots to highlight relationships between variables. Avoid using 3D charts or decorative visuals that don’t add value.
- Leverage Visual Cues for Clarity: Use color, size, and shape to indicate relationships and emphasize important points. For example, using different shades of the same color to show different categories or applying color saturation to indicate magnitude can help users interpret the data more intuitively.
- Simplify Visuals: Stick to simple and straightforward visualizations. Remove any unnecessary chart elements like excessive gridlines, borders, or decorative icons. Use annotations or tooltips to provide additional context without overcrowding the visualization.
Example Strategy: If you need to show revenue trends over multiple years, use a line chart with distinct colors for each year, along with a secondary axis or tooltip to show percentage changes. This keeps the visualization clean and interpretable.
3. Ignoring Context and User Workflow
The Mistake:
Designing dashboards without considering the context in which they will be used or the workflow of the end-users is another common mistake. Dashboards that don’t integrate smoothly into a user’s daily activities or fail to provide the right level of detail at the right time can become a hindrance rather than a help.
How to Avoid It:
- Understand User Needs and Context: Conduct user research and create user personas to understand how different users will interact with the dashboard. Identify their primary goals, the context in which they’ll use the dashboard, and the typical decisions they need to make. This ensures the design supports their workflow and provides information that is immediately actionable.
- Design for User Roles: Tailor dashboards for different user roles. For example, a dashboard for a C-suite executive might focus on high-level KPIs like overall revenue and market share, while a dashboard for a marketing manager might include detailed campaign performance metrics.
- Create a Logical Flow: Organize the dashboard content in a logical flow that aligns with user expectations and workflows. For example, start with a high-level overview and then provide more detailed views or filters that users can interact with to gain deeper insights.
Example Strategy: If you’re designing a dashboard for a sales team, include filters that allow users to switch between different time periods (e.g., quarterly or yearly), view sales data by region or product, and see individual performance metrics. This contextual information helps the sales team make decisions more effectively without having to navigate multiple screens or systems.
How to Evaluate and Optimize Existing Dashboard Design
Creating a dashboard is only the first step. Once it’s live, it’s essential to evaluate its performance and usability to ensure that it continues to meet user needs and provide value. Regular optimization and iterative improvements can significantly enhance the effectiveness of your dashboards.
Performance Optimization
Dashboard performance is a critical factor in user satisfaction. A dashboard that takes too long to load or responds slowly to user interactions can lead to frustration and decreased productivity. Here are some key techniques for optimizing dashboard performance:
- Optimize Data Queries: One of the most common causes of slow dashboards is inefficient data queries. Optimize your SQL queries or API calls by using indexed fields, avoiding nested subqueries, and fetching only the necessary data. Consider implementing query caching for frequently accessed datasets to reduce load times. Use APIs with proper governance and role-based access controls to streamline data retrieval securely.
- Reduce Data Points and Visual Complexity: Displaying too many data points or overly complex visualizations can slow down the dashboard. Limit the number of data points displayed in charts, and use simplified visualizations wherever possible. Aggregating data at a higher level can also reduce the amount of processing needed.
- Leverage Asynchronous Data Loading: Implement asynchronous data loading for charts and widgets that don’t need to load simultaneously. This allows users to interact with parts of the dashboard while other elements continue to load in the background, providing a smoother experience.
- Optimize Image and Asset Sizes: Reduce the size of images, icons, and other assets used in the dashboard. Use vector graphics or compressed image formats (e.g., SVG, WebP) to minimize loading times.
- Implement Lazy Loading: Use lazy loading techniques for components that are not immediately visible or necessary on the initial screen. This approach ensures that only the critical elements load first, while others are rendered as needed, reducing the initial load time.
Tip for Designers: Test your dashboard’s performance regularly by using browser developer tools to measure load times, network requests, and rendering performance. This helps identify bottlenecks and optimize the overall user experience.
User Testing and Feedback Loops
User testing is a crucial step in ensuring that your dashboard is not only functional but also intuitive and effective. By observing how users interact with the dashboard and gathering their feedback, you can uncover usability issues and identify areas for improvement.
- Conduct Usability Testing: Perform usability testing with real users who represent your target audience. Set up scenarios where users complete specific tasks, such as finding a particular metric or applying a filter. Observe how they navigate the dashboard, and note any points of confusion or difficulty.
- Use A/B Testing: If you’re considering design changes, use A/B testing to evaluate different versions of the dashboard. Compare metrics such as task completion time, error rates, and user satisfaction to determine which version performs better.
- Collect User Feedback: Encourage users to provide feedback on their experience with the dashboard. Use built-in feedback forms, surveys, or direct interviews to gather qualitative insights. Pay attention to recurring themes in feedback, such as unclear visualizations or missing data.
- Iterate Based on Insights: Use the insights gained from testing and feedback to iterate on the dashboard design. Implement changes in small increments, and test each iteration to ensure it addresses the identified issues without introducing new problems.
Tip for Designers: Use UXPin’s interactive prototypes to create realistic dashboard simulations for user testing. This allows users to interact with the dashboard as if it were a live environment, providing more accurate feedback.
Tools for Dashboard Design Evaluation
Choosing the right tools can make evaluating and optimizing dashboards more efficient. Here are some recommended tools for different aspects of dashboard evaluation:
- Usability Testing:
- Lookback.io: Record user sessions and observe how users navigate your dashboard in real time. You can also conduct live interviews and collect qualitative feedback.
- UserTesting: Create and distribute user tests to a large pool of testers, and receive video feedback along with quantitative data on user interactions.
- UXPin Prototyping: Use UXPin to create interactive prototypes of your dashboards, enabling you to test functionality and gather feedback before development.
- Heatmaps:
- Hotjar: Use heatmaps to see where users click, scroll, and interact most on your dashboard. This helps identify which areas attract the most attention and where users might be experiencing difficulties.
- Crazy Egg: Offers click maps, scroll maps, and confetti reports that show how users are interacting with the dashboard. Use this tool to refine layouts and improve engagement.
- Performance Monitoring:
- Google Lighthouse: An open-source tool for auditing the performance of web pages, including dashboards. It provides insights on load times, accessibility, and best practices.
- New Relic: Monitor the performance of your dashboards and identify backend issues such as slow API responses or database queries. It provides detailed performance metrics and alerts for real-time monitoring.
Tip for Designers: Use these tools in combination to get a comprehensive view of how your dashboard is performing. For example, start with usability testing to identify major pain points, then use heatmaps to verify user behavior, and finally, employ performance monitoring tools to optimize loading times.
Future Trends in Dashboard Design
The field of dashboard design is evolving rapidly as new technologies and methodologies reshape how businesses interact with data. Emerging trends like AI-powered dashboards, augmented analytics, and heightened focus on data privacy are setting new standards for usability and functionality. Staying ahead of these trends will enable designers to create dashboards that not only meet today’s needs but are also future-proof. Let’s explore these key trends and their implications for dashboard design.
1. AI-Powered Dashboards: Automating Insights and Personalization
Artificial intelligence and machine learning are transforming how dashboards operate and deliver value. AI-powered dashboards go beyond static data presentation by leveraging algorithms to analyze data, detect patterns, and generate automated insights. These dashboards can identify trends, anomalies, and correlations that might be difficult for users to spot manually, enabling quicker and more informed decision-making.
- Automated Insights: AI can scan through massive datasets and automatically surface key insights, saving users time and reducing the cognitive load. For instance, an AI-powered sales dashboard might highlight regions with declining performance or suggest potential causes for a sudden drop in revenue based on historical data.
- Personalization: AI can tailor the dashboard experience to individual users by learning their preferences and usage patterns. Personalized dashboards can prioritize metrics and visualizations based on what’s most relevant to each user. For example, an operations manager might see real-time production data, while a finance executive views high-level financial KPIs, all within the same dashboard environment.
- Predictive and Prescriptive Analytics: AI enables predictive analytics by forecasting future trends based on historical data, and prescriptive analytics by recommending actions to optimize outcomes. For example, in a product management dashboard, AI might predict product demand for the upcoming quarter and suggest changes to the supply chain to meet that demand efficiently.
Design Consideration: To incorporate AI-powered elements, ensure your dashboard design includes space for dynamic insights, recommendations, and alert systems that can update in real-time as new data comes in. Use UXPin’s interactive components to simulate how these AI-driven features would behave in a live environment.
2. Augmented Analytics: Making Dashboards More Actionable
Augmented analytics is a growing trend that enhances traditional dashboards by integrating advanced analytics features like natural language processing (NLP), conversational analytics, and automated data preparation. This trend is making dashboards more accessible to non-technical users and enabling more sophisticated data analysis without requiring advanced data science skills.
- Natural Language Processing (NLP): NLP allows users to interact with dashboards using simple language queries, such as “What were our top-selling products last quarter?” or “Show me sales trends over the past year.” This capability democratizes data access, allowing users to ask complex questions without needing to know SQL or other programming languages.
- Conversational Analytics: Integrating chatbots and voice-enabled assistants within dashboards provides an intuitive way for users to explore data. For example, a user can ask the chatbot to “Show me the highest performing campaigns in the last month,” and receive an instant, visual response.
- Automated Data Preparation: Augmented analytics tools can automate time-consuming tasks like data cleansing, normalization, and aggregation. This ensures that the data displayed on dashboards is always up-to-date and ready for analysis, reducing the chances of errors and inconsistencies.
Design Consideration: Designers can support augmented analytics by incorporating search bars, chatbot interfaces, or dedicated panels for conversational queries. UXPin’s prototyping tools can help visualize these interactive elements, enabling designers to test and refine these features.
3. Data Privacy and Security Considerations
As dashboards become more sophisticated and data-driven, ensuring data privacy and security is paramount. With increasing regulatory scrutiny and data breaches making headlines, it’s essential to incorporate best practices for data security and compliance in dashboard design.
- Data Encryption and Secure Access: All data presented on the dashboard should be encrypted, both in transit and at rest, to protect against unauthorized access. Implement secure authentication methods, such as single sign-on (SSO), multi-factor authentication (MFA), and role-based access control (RBAC) to ensure that users only have access to the data they’re authorized to view.
- Compliance with Regulations: Ensure that dashboards comply with relevant data privacy laws and regulations, such as the General Data Protection Regulation (GDPR) in the EU or the California Consumer Privacy Act (CCPA) in the U.S. This includes providing users with options to view, export, or delete their personal data as required by law.
- Data Anonymization: For dashboards that handle sensitive or personally identifiable information (PII), use data anonymization techniques to mask identities and prevent data breaches. This can include aggregating data at a higher level or using pseudonyms to replace sensitive fields.
- Audit Trails and Monitoring: Implement audit trails to track who accesses the dashboard and what changes are made. This helps ensure accountability and provides a clear record of data usage. Use monitoring tools to detect and respond to suspicious activities in real time.
Design Consideration: To address security and compliance concerns, design dashboards with clear user permissions and access levels. Include visual indicators to show which data is sensitive and consider implementing features like secure data download or export options with additional authentication layers.
Recommended Resources for Dashboard Design
Here’s a list of resources that offer a well-rounded approach to mastering dashboard design—from foundational concepts and practical guides to community engagement and hands-on tools.
- Books:
- Practical Reporting: A guide covering practical strategies, visualization techniques, and design principles for creating effective dashboards.
- The Big Book of Dashboards by Steve Wexler, Jeffrey Shaffer, and Andy Cotgreave: Features real-world scenarios and practical advice for designing dashboards across industries.
- Information Dashboard Design by Stephen Few: Explores best practices and visual design principles to create at-a-glance monitoring dashboards.
- Blogs & Websites:
- Practical Reporting Blog: Offers insights, tutorials, and industry trends in dashboard design.
- Data Viz Project: Provides examples and guidelines for different types of visualizations, ideal for dashboard designers.
- Courses:
- LinkedIn Learning: Learning Data Visualization: Covers foundational concepts and visualization techniques applicable to dashboard design.
- Tools:
- UXPin: Create fully interactive dashboard prototypes using real components, enabling designers to test complex interactions.
- Tableau Public: Experiment with different dashboard layouts and visualizations in a free and open platform.
- Communities:
- Reddit: r/DataIsBeautiful: Share your work, get feedback, and discover inspiring dashboards from the community.
- Tableau Community Forums: Engage with other Tableau users to learn advanced techniques and get support for dashboard projects.
Frequently Asked Questions
What are dashboard design principles?
Dashboard design principles are guidelines that help designers create data displays that are clear, usable, and actionable. Core principles include establishing visual hierarchy, maintaining consistency, minimizing cognitive load, making data accessible, and incorporating accessibility standards.
What are the four types of dashboards?
The four main types are analytical dashboards (for trend analysis and strategic decisions), operational dashboards (for real-time monitoring), strategic dashboards (for executive-level KPI tracking), and tactical dashboards (for mid-level management and short-term goals).
How do I avoid information overload in dashboard design?
Prioritize key metrics aligned with user goals, use visual hierarchy to differentiate primary and secondary information, implement progressive disclosure (show summaries first, details on demand), and use drill-downs and filters rather than displaying everything on one screen.
What makes a dashboard accessible?
An accessible dashboard uses sufficient color contrast, avoids relying on color alone to convey information, supports screen readers with ARIA labels, enables keyboard navigation for all interactive elements, and follows WCAG guidelines for text sizing and spacing.
How can I prototype a dashboard with real components?
UXPin Merge lets you design dashboards using actual production React components from libraries like MUI or your own design system via Git integration. Prototypes behave like the final product, with working filters, drill-downs, and dynamic data — and the code is exportable for development.
Can AI help design dashboards?
Yes. UXPin Forge can generate dashboard layouts from text prompts using your production component library. Describe the dashboard you need, and Forge produces an interactive, code-backed prototype that you can refine and export as production-ready JSX.
Create Stunning Dashboard Designs with UXPin
Effective dashboards are the intersection of data science and design craft. They must be visually clear, functionally robust, and tailored to the specific needs of their users. The principles, best practices, and examples in this guide give you a solid foundation for building dashboards that drive better decisions.
UXPin Merge makes dashboard prototyping faster and more accurate by letting design teams work with real, production-ready components synced from Git repositories. The result: interactive prototypes that mirror the final product’s behavior, with working filters, drill-downs, and dynamic data updates.
Benefits of UXPin for dashboard design:
- Code-Backed Prototyping: Design with real MUI, Ant Design, or custom React components. Your prototype behaves exactly like the production dashboard.
- AI-Powered Generation: Use Forge to generate dashboard layouts from text prompts or reference images, using your actual component library.
- Faster Iteration: Changes reflect instantly because you’re working with real components. Enterprise teams using Merge report up to 50% reduction in engineering time.
- Production-Ready Output: Export JSX directly from your prototype. No redlining, no guessing — what you design is what gets built.
Try UXPin for free or explore Merge to build dashboards with production-ready components.